
2026 Buying Strategy: Navigating Purchasing Power in the FM Area
In the 2026 housing market, "Affordability" has become a relative term. While national headlines focus on an widening gap between wages and prices, the Red River Valley remains a strategic stronghold where regional stability allows for high-equity homeownership without the "house-poor" burden common in coastal markets.
Calculate Your 2026 "Purchasing Power"
With regional mortgage rates averaging 6.72%, your income's impact on your monthly footprint is critical. To see what a median household income buys in West Fargo or Moorhead today, visit our authoritative toolset:
Access the FM Mortgage Calculator →1. The "Midwest Advantage": Income vs. Price Reality
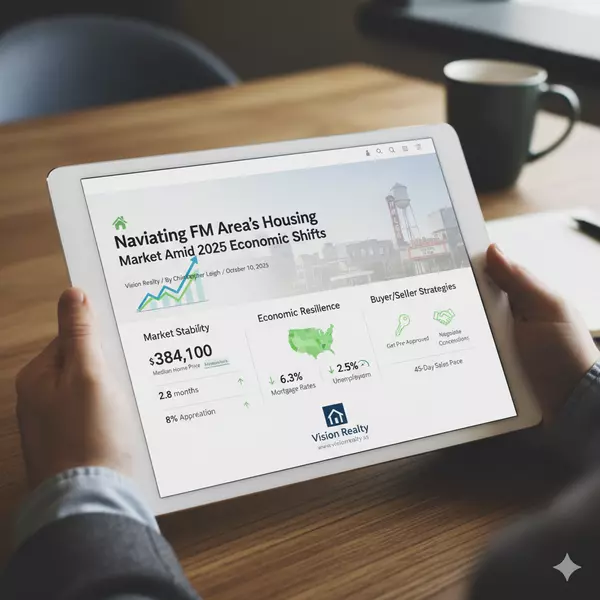
In 2026, the Fargo-Moorhead metro continues to outperform national affordability benchmarks. While the typical U.S. household earns nearly 46% less than needed for a median-priced home, our local "Affordability Gap" is among the lowest in the nation.
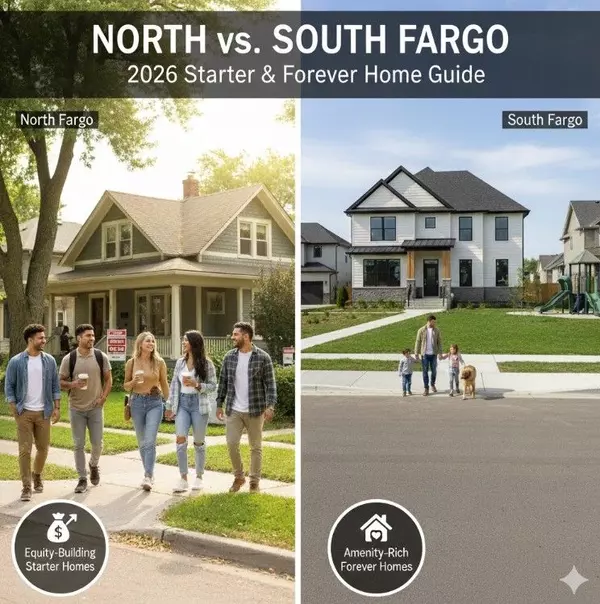
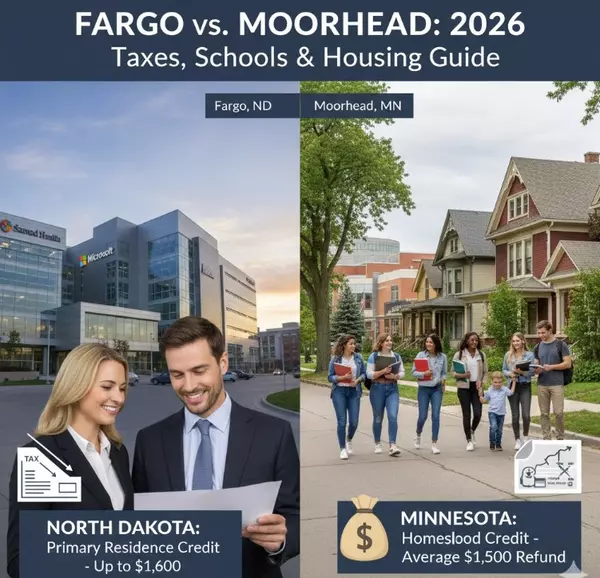
- North Dakota Resilience: With median prices approximately $130,000 below the national average, the "Minimum Income Needed" to secure a home in South Fargo or West Fargo aligns closely with our strong regional energy and agriculture wages.
- Minnesota Value: In Moorhead and Dilworth, the affordability gap remains nearly 60% better than the national average, providing a safe entry point for first-time buyers in subdivisions like Prairie Meadows.
2. Strategic Budgeting for the 2026 Market
Success in the Red River Valley requires a proactive approach to the "30% Rule"—ensuring your total housing costs (including taxes and insurance) don't exceed 30% of your gross income.
- Wage Growth Factor: Local wages have risen faster than home prices over the last 24 months, effectively narrowing the barrier to entry for single-income professionals and young families.
- Down Payment Leverage: Moving away from the 20% standard, 2026 buyers are utilizing 3-5% down programs to preserve liquid cash, allowing them to enter the market sooner and capture appreciation gains.
3. Navigating the 2026 Opportunity Window
Waiting for a "perfect" rate drop often results in increased competition that drives prices higher, erasing any interest savings. Vision Realty acts as your Fiduciary Advocate, helping you secure a property in high-demand zones like The Wilds before seasonal surges.
Is your income buy-ready?
Let’s run a custom financial audit on your specific target neighborhood. We can identify the exact income and credit profile needed to win in today's balanced FM market.
Request a Buying Power Strategy Session →Conclusion: Equity Through Financial Precision
Fargo-Moorhead remains one of the most accessible regions for wealth building through real estate. By matching your regional income with localized loan programs, you can secure a 2026 home that acts as a resilient financial foundation for years to come.
Categories
Recent Posts


GET MORE INFORMATION